Friday, May 12, 2017

Tomah, WI Wetland Flights

On Tuesday, May 10th, the class met at a wetland area near Tomah, WI, just south of I-90 right before it met with I-94. Two flights, one with the Trimble UX5 and one with the DJI M600, were made to get a baseline set of imagery to observe vegetation changes in the future with more flights. The flights in the future will use the MicaSense RedEdge multispectral sensor so that vegetation health and type can be assessed with indexes and spectral signatures using other bands than simply RGB.

10 GCPs were laid out covering a wide area of the wetland. These were spread far enough that to reach some areas efficiently a truck was driven. Each GCP had its coordinates taken with survey grade GPS.

The UX5 overlap was set to 80% and the height was set to 400 feet. The fixed wing UAS is completely automated (no manual control takeover) and did the job in about 40 minutes. The craft can fly up to 50 mph and also in 30 mph winds. 

The M600 flew at 70 m. After this final flight, the GCPs were collected. Problems occurred in trying to fly this craft because the Pix4D flight planning software was crashing. Finally, the software worked and the M600 had a successful flight.
UX5 in its Case

UX5 Controller Showing Polygon Flight Plan

Trimble Made Custom Sony Sensor

DJI M600

DJI Box with RTK and Control Tablet

Northern-Most Section of the Study Area

Trimble UX5 Ready for Slingshot Launch


Sunday, May 7, 2017

UAV Flight with GCPs Covering the Eau Claire South Middle School Community Garden

Introduction:

On May 2nd, 2017, at 3pm, class visited Eau Claire's South Middle School Garden to fly the DJI Phantom 3 and DJI Inspire and capture NADIR and oblique imagery, and collect GCPs with a 2 cm accurate GPS to aid with spatial accuracy in later processing. This experience aimed to give experience in the field with what comprises a UAS flight, and was less focused on the processing aspects which have already been covered and can be seen in the past posts below.

Methods:

Nine GCPs were laid out in the garden on a three by three grid, making sure that the outermost GCPs were close to the fence, and that the grid covered sufficiently the entire garden. The GCPs had numbers painted on them for identification in the images later, but were laid out in a snaking pattern up and down the garden grid the pattern of which was noted in case the numbers were not able to be seen in the imagery for any reason. The locations of each numbered GCP were important because each GCP corresponded to a same numbered point that was recorded on the survey grade GPS unit.

Figure 1: GCP Collection
Figure 2: Screen of the GPS Unit Showing Horizontal and Vertical Precision

When collecting the GPS points with the unit is was of vital importance to make sure the unit was completely vertical using the leveling bubble on the shaft of the unit. This ensured the coordinates at the top of the unit (where communication with satellites was from) were the same as the coordinates at the point at the bottom of the shaft where the shaft met the center of the GCP board. It was also of vital importance that the GPS unit was set up to be using the UTM coordiate system. Points were taken in the same snaking pattern as the GCP boards so that the numbers on the boards corresponded with the numbers of the points being taken.

Figure 3: GPS Leveling

After getting the GCPs taken, the class could move on to UAS flight. As the location had been used before for testing, it was known that there was LTE signal, and that the Verizon MiFi device would successfully be able to supply WiFi. Because of this, flight planning was left for the field as base map data could be pulled down in the field. If it was unclear that there would be signal, basemaps would have been cached in advance onto the control tablet int he control software.

Figure 4: The DJI Phantom 3 Advanced

This availability of internet connection was also vital when it was found that the DJI done would need to update its firmware. Firmware updates on DJI drones are not optional, and drones will not fly unless the newest updates have been done.

Figure 5: South Middle School Community Garden

After the updates, the Phantom was flown. The drone was planned there in the field to make a snaking pattern covering of the polygon created in the software covering the garden using an elevation of 70 m AGL (above ground level). The takeoff and landing points were made to be the same, and the rally point was also that same point. Rotors and other pieces of the aircraft were then attatched. The takeoff was then made manually as is always done. After takeoff, and rising to an appropriate elevation to play around with controls, turns were made in all directions and all other functionality was tested to make sure that the automated mission would be a success. Then, the drone was raised to the elevation that the mission would be conducted at before starting the mission, as is good practice so that the drone would not hit anything at lower altitudes en-route to the start of the mission. When the drone returned to its starting position and began to beep, letting the PIC (pilot in control) that the mission was over, the PIC gave the drone the command to begin automated descent and landing.

The result if the phantom flight is shown below. The markings are of the nine GCPs.

Figure 6: Overview of NADIR Phantom Flight with GCPs

The Phantom also flew another flight using the same procedures. This flight was planned to capture oblique imagery along the road, however. The three dimensional model created from that data, processed in Pix4D just like the NADIR imagery except with the three dimensional model template option selected, is shown in the below figures. This flight flew a corridor along the road, and therefore covers far less area. The area it does cover however is more accurate. This can be seen when contrasting the sides of the cars that face away from the garden on the opposite side of the road as the garden in the NADIR and the oblique data models.

Figure 7: Oblique 3D Model

Figure 8: Alternate View of Oblique 3D Model

Thursday, April 27, 2017

Creation of GCP Markers

On Tuesday, April 25th, 2017, the class met at Dr. Joseph Hupy's home to cut and paint ground control point (GCP) markers. A high density polyethylene sheet with one sleek side and one rough side (which holds onto paint better) was used. The material was picked for its resistance to water and strength, as wood would be more prone to breaking and decomposing under the ground or the weight of machinery used at the mine sites that the GCPs would be possibly used at later. The material is also heavy enough to resist forces that might move it from its placement. This sheet was cut into squares using a table saw and another table for support, then the squares were painted using neon spray paint and utensils, with a different number being drawn on each finally for later identification in images. The images below show the production process of these GCPs.
Painting While Holding Down Stensil

Partially Completed GCPs

Completed GCPs Drying

Sunday, April 23, 2017

Mission Planning Basics with C³P

Introduction:

Without proper mission planing, a safe and practical mission cannot be flown. For example one must take into consideration drone battery life, weather conditions, elevations, areas where people are and flying would be illegal, and other obstacles such as radio towers and buildings that could affect flying. In this assignment mission planning is examined and practiced. Essentials before departure and in the field are explained. Then, the C-Astral made C³P mission planning software is explored, with basics such as the different terms, symbols, buttons, and windows with their specific functions covered. Next, the software is used to create two mission plans, one on the test field that automatically comes up when the software is opened, and another a field in Madison, WI. Finally the software is reviewed with summary of features and opinions.

Part 1: Mission Planning Essentials and Situational Awareness

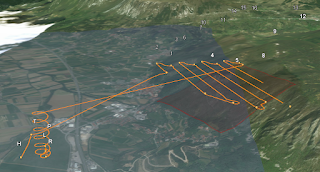
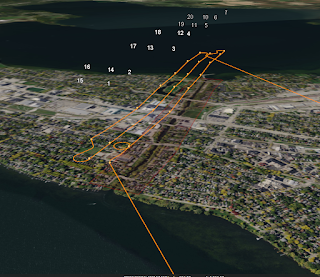
Proper flight planning before departure is essential for later successful flight and mission goal completion. For preparation the study site needs to be known in as close to totality as possible. The cellular signal strength of the area needs to be known so that map data can be stored on the piloting computer or tablet ahead of time if there is not going to be signal in the field. It needs to be anticipated if crowds of people will be around the area flown because these are dangerous and illegal to fly over. Terrain, vegetation, and man made obstacles such as buildings and towers need to be known of so that correct flight paths and elevations can be chosen, and appropriately flat surfaces can be used to land on. These phenomena should be observed in person if possible, but geospatial data such as elevation contour (topographic) maps, aerial and satellite imagery, DEMs, and other information can and should be used as well. Many layers are available in the the C³P software, and three dimensional models of the flight plan can be viewed in the ESRI ArcGIS Earth software with the click of the 3D view under the map button menu (Figure 1).
Figure 1
A good idea is to draw out multiple mission plans for the same area. This ensures another plan is available in the event of unforeseen obstacles.

Weather for the entire time of UAS operation should be attended to. Wind, air temperature, air pressure, visibility (drones must always be in line of sight), and rain can all affect flight performance. Wind direction should be considered also because fixed wing UAS needs to take off towards the direction wind is coming from for maximum lift. Also all batteries need to be charged in preparation. 

Immediately before departure all equipment should be checked off of the checklist, and examined. A final weather check should also be done. The conditions and forcast may have changed since the last time checked, and if they have, flight may not be possible that day.

In the field planning must be done as well. Cellular network connection should first be confirmed. Field weather with wind speed, direction, temperature, and dew point must also be checked. This can be done with a pocket weather meter such as the Kestrel 3000 and a flag for direction. Vegetation and terrain must then be assessed for new or changed conditions, and to see if the flight plan will still work. Electromagnetic interference must be accounted for as well. Magnetic fields come with many metal objects, power lines, and power stations which can confuse the instruments on board the aircraft and the flight. These objects to be weary of can be underground (as with cabling or concrete rebar), on the surface (as with power stations), or in the air (as with power lines). 

Other information for planning the flight needs to be found as well. The elevation of the launch site needs to be found so that an operator can be aware of where the aircraft is in relation to the launch site and landing site, and because some flights will require the information so that the drone can fly a consistent height above that elevation above that height for consistent spatial resolution. Standard units for flight should also be established between operators and planners so confusion will not arise. Metric, because it is the standard throughout the world, and is used in the Slovenian company C-Astral's software, is the obvious choice. 

Finally, before flight, the missions previously planned should be reevaluated, and necessary changes made. 

Part 2: Software Demonstration
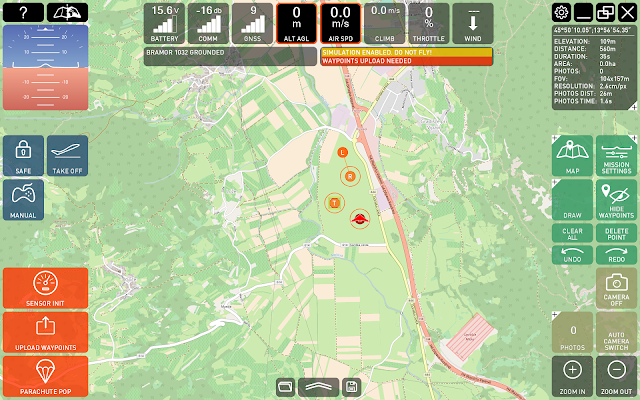
Figure 2
Figure 2 shows the entire main interface of the C³P software. Front and center is the map. Two maps can be toggled back and forth using the button in the top left corner shown in Figure 3. The maps default to the Google Terrain Map, and the Open Street Map. They can be changed, however, using the configuration button (Figure 4), the map tab in the window that opens, then the drop down menu. The best configuration is one map with imagery instead of digitized features, and one map that can show elevation.

Figure 3
Figure 4
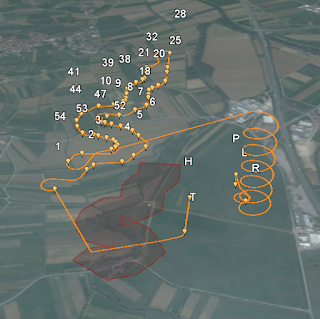
On the map are symbols that denote different areas used in the flight. There is an H that denotes the home area, the area where the control crew is stationed, a T that denotes the area of takeoff, an R, which denotes the area of Rally, the area where the UAV flies before its starts its final approach, and an L which denotes the landing area. All of these areas can be resized by hovering over the edge of the circle, clicking, and then dragging, to give the software more leeway in flight operation and designate a larger area for a certain function. These symbols can be seen in the center of Figure 2. Click on this figure in order to see a larger version.

The mission settings window (Figure 5) can be used to adjust altitude, speed, sidelap and overlap, GSD, and overshoot. This window can be activated by the mission settings button shown on the right in Figure 2. Altitude can be set to a relative distance above ground level, or an absolute altitude above takeoff ground level (AGL). Speed must be set considering the speed at which the UAV will stall. The sidelap and overlap will adjust the distance between each flight path so that the percentage amount specified overlaps in the image with the next image, important for post processing. The GSD is the distance between each pixel on the ground, meaning that with a larger GSD a smaller spatial resolution will occur. Finally, overshoot is the distance outside the demarcated boxed area or street (corridor) area that the UAV can travel in order to turn around and enter on the next flight line.
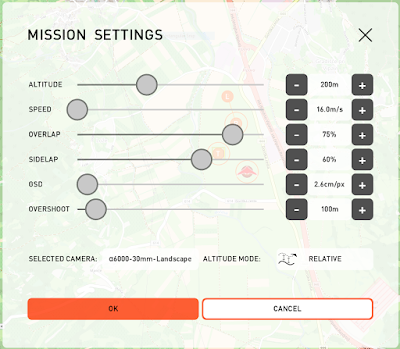
Figure 5

The draw features are used for drawing a flight plan. They are all depicted in Figure 6, which shows the open draw menu drawer. The measure tool can come in handy to find distance between area that need to be avoided and the flight path, as well as in appeasing other curiosities. The street points function can be used to draw along the center of a street, corridor, or power line, and later the width of the flight path can be extended to include more flight lines. The area points function lets one draw a unlimited sided polygon which covers the area desired to fly. The way points function lets one draw any path they would like to fly by the use of single points the UAV will fly through. All functions can be used by first opening the draw menu drawer with a click, then clicking on the appropriate tool, then clicking to make points on the map. Clicks with the street points tool should go down the middle of the line that one would like to cover, clicks with the area points tool define the corners of the polygon, and clicks on the map with the way points tool create points that the UAV will fly directly through.

Figure 6
The map menu button opens a drawer of map related features (Figure 6). One can jump to previous or new locations with the jump to location button, follow the UAV with the follow UAV button, show the trail of the flight, and even jump to a three dimensional view of the flight, which is opened in ESRI ArcGIS Earth if available (it is freeware), or Google Earth. This is an extraordinary feature for viewing the terrain interfering with the flight in planning.


Part 3: Working with the software

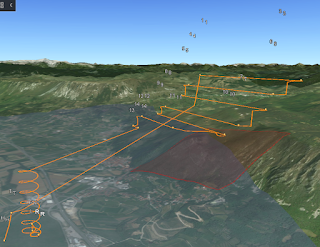
A few missions were planned for the Bramor test field that show what happens when altitudes settings are changed. Figure 7 shows a route for example which was made with the area points tool, whose flight is at an absolute elevation and is too low for the mountain area. The red points show the areas where the flight is too low and will hit the mountain. Figure 8 is the three dimensional view in ArcGIS Earth the right side of which shows this conflict.
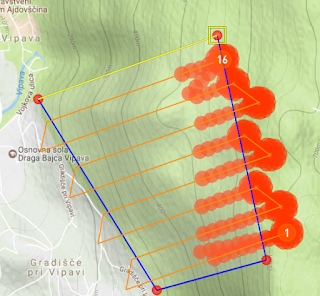
Figure 7
Figure 8
The flight path could be moved higher so that there would be no issue with intersection of the mountain, but a better way to mitigate this problem while also ensuring that that the spatial resolution of the area covered is consistent would be to make the elevation relative. This was changed in the mission settings window and the resulting flight is shown below in Figure 9 and 10. Also changed was the direction of the flight lines by dragging to resize the edge of the perimeter that runs the way the flight lines are desired. Flight lines should always go the long way, especially in this specific situation where more elevation climbing and descending would be necessary, even in overshoot, if the flight lines were perpendicular to the contour lines. Overlaps were set to the recommended setting for use with Pix4D. 
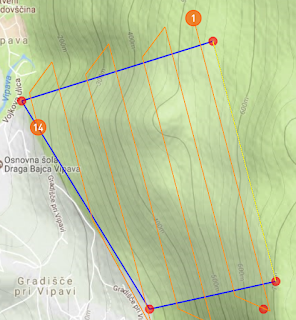
Figure 9
Figure 10
The next flight, which flies a corridor, is depicted in Figures 11 and 12. The overlap again was set to an appropriate amount, the elevation set to relative for a consistent spatial resolution, and the width of the corridor changed to include a far reaching area. For efficiency, this plan put the takeoff area near the first point at the south area of the flight plan and the landing at the top. The rally area was moved to fit this design and be at the north of the field. The landing area was also strategically placed so that the UAV would not be landing towards, and possibly hitting, the home area. This placement would work only if the wind allowed the UAV to take off in the direction shown.
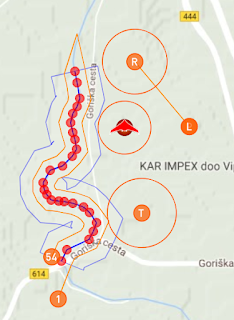
Figure 11
Figure 12
The last flight planned was one in Madison, WI, along the Yahara River connecting Lake Mendota to Lake Mendota. This plan was a corridor type plan. It again used relative elevation AGL for consistent spatial resolution. It is depicted in Figures 13 and 14.
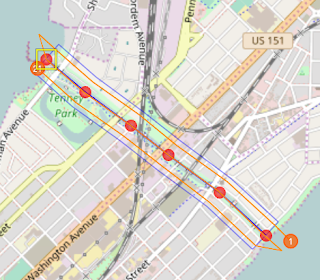
Figure 13

Figure 14

Part 4: Review of C³P:

At this point most functionality of this software has been covered and reviewed as well as mission planning essentials outside of the computer work. With the software's tools one can design different types of flights, and do it well informed because of the variety of geospatial data and three dimensional views that are offered.

The software struck me as fairly intuitive, and well featured, however there are a few features that I wish the software had. One is a drop-down menu of the different map views on the main interface screen. Having to go into the settings every time could be tedious and annoying in the field especially during flight if more information not available on a current map is desired. Another feature that could be included relating to this would be more map views to toggle through, and instead of a toggle button, the names of the different maps being displayed to tap or click on. This however may take up too much space on a tablet screen, and that is why the feature was not included. Another feature that could be included would be maps with elevations of buildings. This could aid the software in finding appropriate heights to fly at. At the current moment the software does not include the height of buildings and other man made structures so these have to be researched and included in planning so nothing goes awry. Towers and other structures besides buildings need to be considered alongside buildings.

Monday, April 17, 2017

Processing Oblique UAS Imagery Using Image Annotation

Introduction:

Fittingly for a geography and GIS associated class, all projects up to this point have focused on bird's eye view or NADIR (directly below sensor) remote sensing UAS data. This data was then processed for DSM and orthomosaic raster image data which could be brought into ESRI software and other software for mapping and further processing like value added data analysis.

In this project however, oblique imagery is used in conjunction with image annotation to create a stand-alone three dimensional model of a specific object. The 3D Models processing template option is chosen instead of the 3D Maps option or the Ag Multispectral option. Image annotation refers to the user defined specification of the object of interest in pictures from which the three dimensional model is created. This process involves the user picking out each software-found set of pixels (which are grouped by similar color) that is the background and not the object of interest.

After a proper amount of images are annotated, covering many angles of the object, a 3D model can be built by the Pix4D. These models are used for building and tower inspection, as well as other uses. More fields are using these model every year due to the relative ease and low cost of UAS flight, image capture, and processing.

Before processing, images needed to be captured. These images were captured low to the ground at various heights always pointed at the object with 360 degrees of coverage at each height of the object. Information is given in the Pix4D manual on how to capture oblique imagery for 3D models. The manual suggests flying around a building with a downward angle of 45 degrees first, then again at a higher altitude with a downward angle of 30 degrees. For best results the manual recommends flying at various heights between these as well.
Figure 1

Methods:


After obtaining the sets of UAS captured images from the instructor of the course, they were each processed with Pix4D twice. They were each processed once with annotation before the second step was run, and once with no annotation run.

A new project was mad six times. Each time, the project was given a descriptive name, then the directory with the specific images wanted was selected with the Add Directories... button in the Select Images step of the wizard. Next, the camera settings were changed in the Image Properties step of the wizard. The edit button was clicked (highlighted in Figure 2), then the edit button in the resulting window was clicked and the Shutter Model dropdown box setting was changed to Linear Rolling Shutter (buttons highlighted in Figure 3). Going on, the spatial reference information was not changed, however in the last step of the wizard, the template chosen was the 3D Models option instead of the other options that were used in past projects (Figure 4).

Figure 2
Figure 3
Figure 4
From here initial processing was started. This was done by making sure that only the initial processing box was checked in the main interface window of the software, the clicking start (Figure 5).

Figure 5
After this finished processing, annotation could begin. After selecting four to six images that covered a variety of angles on the object in question (only calibrated images were selected because uncalibrated images can be annotated, but their anotation is not processed), each image was selected individually and annotated. The image was clicked on, then the image was viewed in the selection section on the right of the screen. The annotation button was then clicked (highlighted in Figure 6), and the annotation process begun. After annotation, the apply button that would appear where the Disable button is at the bottom of Figure 6 was clicked and the process was repeated with the next image.

Figure 6
Figure 7
In annotation, a mask is applied around the object of focus. For example, in Figure 7, the mask has been applied around part of the image. The mask is the area that is colored purple. The mask is made up by small sections of like colors chosen by the program. Each section can be chosen or deleted by a click, and when zoomed in smaller sections are made available to select that would have been part of a larger section when zoomed out. This feature makes it easier to get the boarder around an object more accurately specified.

Figure 8
After each image has been annotated for a dataset, the second step for the processing can be run (Figure 9). The user must first however make sure that certain settings are turned on. These can be accessed in the second tab of the processing options window and are highlighted in Figure 8.

Figure 9
This completes all necessary processing for the imagery.

Results and Discussion:

Below in are with and without annotation comparisons of processed data for each data set. Figures 10, 12, 14, and 16 are models made without annotation, Figures 11, 13, 15, and 17 were made with annotation. Also for each dataset are flyby videos for the Pix4D project that was processed with annotation.

Dozer:

Despite annotating 5 images for the dozer, not much, if any, difference was made. The outcomes seemed almost the same. The dozer did, however, come out relatively accurate, with the acceptations being the front end (understandably difficult because it is concave), and the gaps between the bars and the cab at the top of the dozer.
Figure 10

Figure 11


Shed:

With the shed, not much changed after annotation. The lack of stray points in the annotated image (Figure 13) is only because a layer was turned off before the screenshot was taken.
Figure 12


Figure 13


Tundra:

The tundra also did not change in any substantial way. Geometry of aberrations changed, but the amount of them did not.
Figure 14

Figure 15


Person:

Our controller gained a head after annotation. This is one of the only substantial changes.
Figure 16


Figure 17
General Discussion:

After processing of images it is apparent that image annotation does not add very much to processing at the level of annotation done here. About five images were annotated for each dataset, which didn't make an substantial changes to outcome. At higher levels of annotation certain details may change. In future experimentation, it would be smart to do a higher level of images, maybe 20 or 30. Also, zooming in farther and paying closer attention to the detail of change between the background and the subject in annotation would be something else to try that may result in higher quality resultant data. Unfortunately, the Pix4D's annotation interface is frustratingly slow to work with, and sometimes is buggy in what it labels as masked and not masked, and in that it changes what one has annotated in the image. For example, sometimes if the image was zoomed into and annotated at a higher level of detail, the unwanted connected pieces of the image also become annotated when the image has been zoomed out. Another complaint for the software is that there is no way to click and drag to highlight and mask a large potion of an image, instead one must slowly go piece by piece in large areas that need to be masked by clicking and slowly moving around while the software catches up and highlights the next piece desired. These things make the software very annoying and time consuming to work with.

Conclusion:

Annotation may help to create higher quality data if done extensively and extremely carefully. This however would require a team of people due to the time consuming and frustrating nature of carefully annotating images. Other processing programs may work better for this function than Pix4D. The three dimensional models made could be very useful, however, in many applications. Building inspection  has been noted as one modern use of this technology, and the field of UAS three dimensional modeling is growing as more uses are being found.

Monday, April 10, 2017

Calculating Volumes

Introduction:

In this lab volumetric functions of two different pieces of software (Pix4D and ArcMap) were used to find volumes of piles of aggregate at a mine near Eau Claire, WI. Two different techniques of finding volume were used in ArcMap: the Surface Volume tool, supplied with a clipped DSM of each individual pile and a value for base height, and the Polygon Volume tool, supplied with a TIN created from the DSM.  DSMs from UAS, tied down with GCPs to ensure spatial accuracy are a great source to find volumes with. This data was already available to work with due to the past Pix4D processing that had been done in the class.

Methods:

Pix4D: This method was by far the easiest method to use. The Pix4D project file created earlier in the semester was opened and the Volumes tab was clicked on on the left of the screen. Next, the new object button was clicked, and the base of each pile traced. From there the compute button was clicked for each object, and the measurements recorded. The three piles that were measured are seen in Figure 1, the first pile measured is seen in Figure 2, the second in Figure 3, and the third in Figure 4.
Figure 1
Figure 2
Figure 3
Figure 4
Surface Volume: This technique was slightly trickier. First the DSM and Orthomosaic were brought into an ArcMap document, then three polygon feature classes were created in a new file geodatabase in the catalog with a right click on the geodatabase (Figure 5). With these three new feature classes care was taken to import the projected coordinate system of the DSM. The editor was then opened under the toolbar menu of the customize menu, and editing was started. After clicking on each feature class, the appropriate pile was traced with a polygon (Figure 6). Editing was now stopped. These three polygons were then utilized to extract their respective areas of the DSM by using the Extract by Mask tool (Figure 7). The three resulting DSMs were then used in the Surface Volume tool (Figure 8), along with a base elevation found by using the identify function, to find the volumes of the areas, which were saved in specified .TXT documents, along with the parameters used.

Figure 5
Figure 6
Figure 7
Figure 8
Polygon Volume: Using the individual DSM .TIF raster files earlier created for Surface Volume tool method and the Raster to TIN tool, TINs were made fore each aggregate pile (Figure 9). These were in turn referenced by the Add Surface Information tool for minimum elevations (Z_MIN), which
were added to feature classes' attribute tables (Figure 10). After this, both the base elevation in each piles feature class, and the TIN for each were referenced by the Polygon Volume tool to find a volume, which was then stored in a volume field for each feature class (Figure 11).

Figure 9
Figure 10
Figure 11


Results and Discussion:


The resulting volumes can be seen in Figure 12, and a map showing the three different piles can be seen in Figure 13.
Figure 12


Figure 13

A few points may be made about the comparability and the accuracy of the three methods' results, and then with this understanding the differences between each result will make sense. One first point is that although effort was made to draw the boarder of the pile in Pix4D the same as how the outline of each feature class was digitized in ArcMap, the results are going to be slightly different, resulting in different extents of area for each pile and slightly different volumes. Next, and most important to resulting volumes, each method calculates the base heights slightly differently. While Pix4D triangulates peripheral Z values to find an uneven base height (Figure 14), the Surface Volume tool, uses a user defined base height (the Plane Height parameter) and calculates the entire area above up to the supplied DSM raster. With the Polygon Volume tool, the same thing happens except the Z_MIN parameter in the feature class that was set from the lowest point on the TIN was used as the base. This made the volume found with this tool substantially larger than the volumes found with the other tools. To use the two ESRI tools for the most accurate results care must be taken in finding a base height or plane from which to measure from on uneven ground.

Figure 14
 https://support.pix4d.com/hc/en-us/articles/202559239-How-Pix4Dmapper-calculates-the-Volume-#gsc.tab=0


Conclusion:

UAS data can be used to find highly accurate volumes of features above the surface if tied down with GCPs so as to be spatially accurate, the different volume calculation options are understood and used skillfully, and the perimeter of the object is drawn carefully. The most automated, yet the most useful and accurate volume function may be the one contained in Pix4D due to its triangulation of an uneven surface below the measured object. Though only used for measurement of piles of mining aggregate in this project, these methods would also work for measurement of volumes of buildings and other above ground accurately sensed objects. Thinking farther, these methods could even be used to estimate volume of below ground objects sensed through GPR or other methods given compatible data is produced.