Introduction:
Pix4D is software that can be used to create point clouds and orthomosaic images from UAS aerial imagery. The software uses advanced algorithms to take overlapping images from the data set and build a three dimensional model of the specific area observed.
Pix4D Basics:
What is the overlap needed for Pix4D to process imagery?
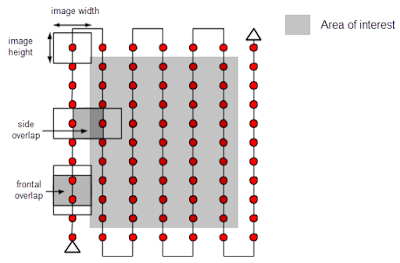
One necessity of UAS data for processing of UAS imagery in Pix4D is adequate image overlap. The recommended overlap in a general case is 75% frontal overlap and at least 60% side overlap. Pix4D also recommends that a regular grid pattern is used (as is shown in
Figure 1) and that a constant height is used for data collection.
 |
| Figure 1 |
What if the user is flying over sand/snow, or uniform fields?
These conditions make it much more difficult for the software to find matching points in overlapping images for processing complex geometry and large uniform areas. For these conditions a minimum of 85% frontal overlap and 70% side overlap should be used. Also recommended is setting exposure settings accordingly on the sensor to get as much contrast as possible.
What is rapid check?
Rapid check is like regular initial processing but doesn't produce as good of an initial image.It is meant to be faster and just for ensuring that there is enough overlap for full processing later.
Can Pix4D process multiple flights? What does the pilot need to maintain if so?
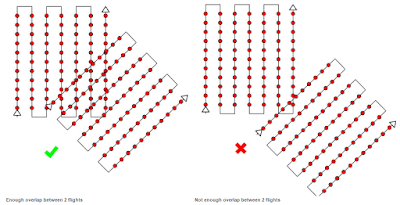
It can however special care must be taken. The flight patterns of both flights must overlap sufficiently, the two flights must be taken in very similar visual conditions, and the spatial resolution (flight height) must be the same.
 |
| Figure 2 |
Can Pix4D process oblique images? What type of data do you need if so?
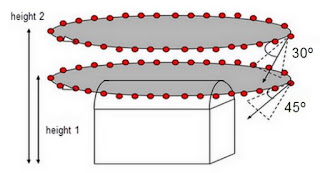
Pix4D can process oblique imagery for three dimensional models, but cannot create an orthomosaic in this mode. The software needs imagery at three different heights above the object being modeled, with each raise in elevation corresponding to a decrease in camera angle. This is shown in Figure 3.
 |
| Figure 3 |
Are GCPs necessary for Pix4D? When are they highly recommended?
Ground control points are not necessary just like georeferencing is not, but should be used in high precision georeferencing applications for the making of an orthomosaic. Situations where GCPs should be used are city reconstruction, and mixed nadir and oblique image aided reconstruction.
What is the quality report?
The quality report give you final quality information after processing of data. This report gives statistics and other information that aid the user in determining the quality and adequacy of the images created for their specific use.
Methods:
 |
| Figure 4 |
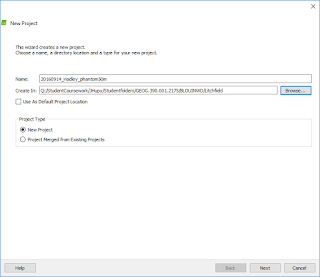
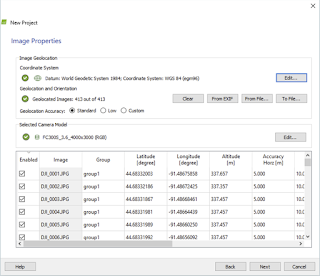
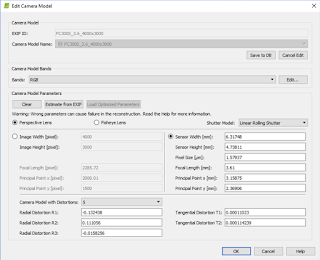
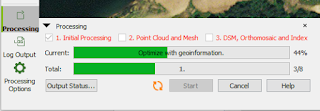
After opening Pix4D Mapper and clicking "New Project," a new project was made with a descriptive title including the name of the site, date, platform, and altitude, and was saved to my personal folder (Figure 4). Next, the images were added to the project (Figure 5). These came from the "Litchfield" folder including folders for two overlapping flights that was supplied by our professor. Now, due to an error not yet fixed in Pix4D the shutter of the camera model used and detected by Pix4D is set to global shutter when in fact it is a rolling shutter. This needed to be changed in the "Edit Camera Model" window so that the settings looked as shown in Figure 6. Clicking on, output coordinate system settings were not changed, and the "3D Maps" "Processing Options Template" was chosen. Now, processing steps 2 and 3 were deselected as shown in Figure 7. The "Processing Options" button also seen in Figure 7 was then clicked and under the third processing step tab the Triangulation method option was selected before the initial processing was started.
 |
| Figure 5 |
 |
| Figure 6 |
 |
| Figure 7 |
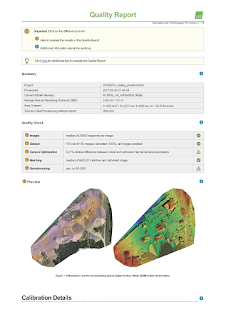
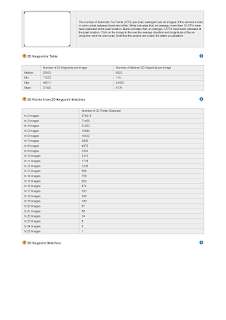
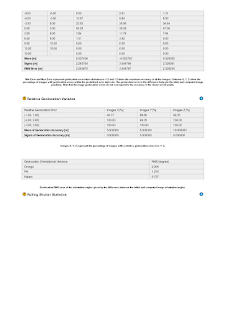
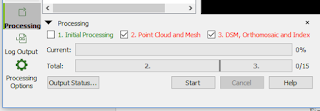
Now, after initial processing was completed and its resulting quality report examined (Figures 8-15), processing steps two and three were selected, "Initial Processing" was deselected, and final processing was run (Figure 16). In the quality report, good overlap was seen everywhere but the edges, where there was understandably less overlap. All images were used by the software.
 |
| Figure 8 |
 |
| Figure 9 |
 |
| Figure 10 |
 |
| Figure 11 |
 |
| Figure 12 |
 |
| Figure 13 |
 |
| Figure 14 |
 |
| Figure 15 |
 |
| Figure 16 |
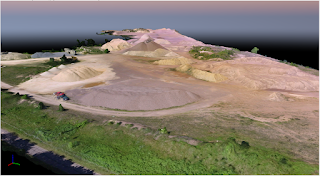
After processing steps two and three finished, experimentation with the resulting DSM display options could be done. Turning off and on individually the tie points, point cloud, and triangle mesh, the various views were examined. A view of the triangle mesh is seen below in
Figure 17.
 |
| Figure 17 |
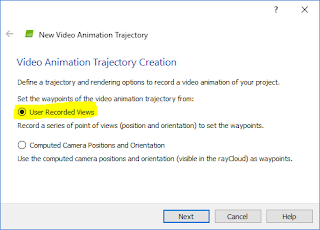
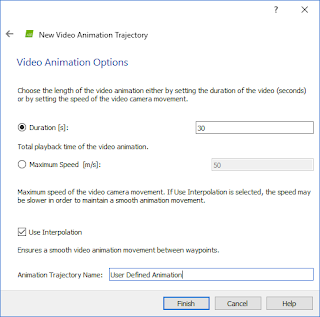
Another way to display the the resulting DSM was a flythrough video animation. By using the button highlighted in
Figure 18, clicking the user recorded views button shown in
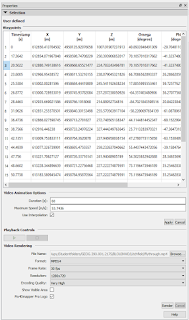
Figure 19, recording individual points, and then using the parameters shown in
Figures 20-21, I rendered a video. The video is shown under these
.
 |
| Figure 18 |
 |
| Figure 19 |
 |
| Figure 20 |
 |
| Figure 21 |
Results:
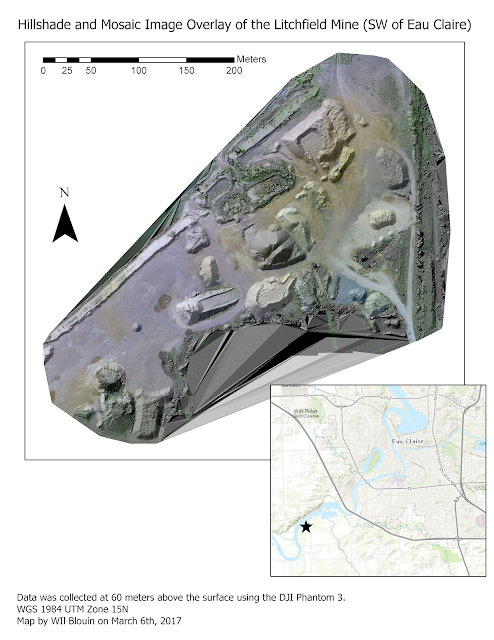
After creating the video (shown below) maps could be created. These are shown in Figures 22-23.
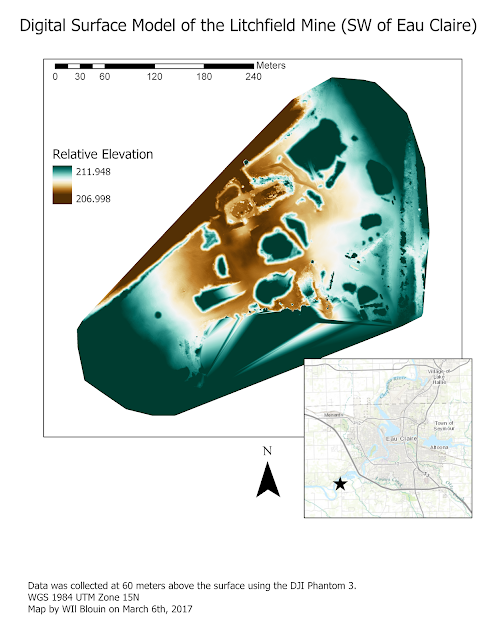 |
| Figure 22 (vertical unit is meters) |
 |
| Figure 23 |
These two maps show the data in different ways and can be cross referenced for clarification about certain areas of the map.
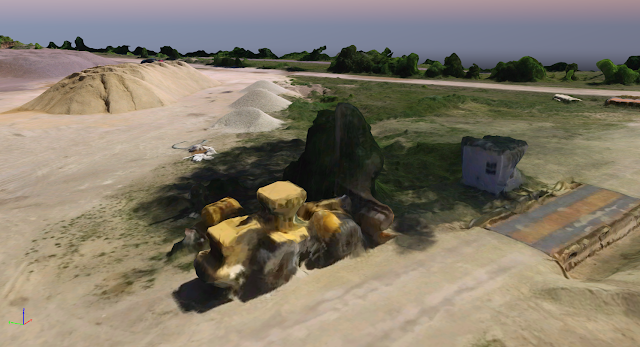
In discussion of the data mapped, a few faults were found, however they are far from serious enough for the resulting three dimensional images to not be used for representation of the mine. First of all, the data is not of high enough quality to successfully recreate cars, tractors, and other machinery that was at the site. This can be attributed to the orientation and distance from these objects that the images were taken from. If recreation of these complex geometrical objects was the goal, oblique imagery from multiple angles and heights for the objects would have to be taken, and even then errors may occur. An example (a tractor) is shown below in
Figure 24.
 |
| Figure 24 |
Another point of discussion of this data is that there were no ground control points taken or used, and thus the resulting image from the process is not an orthomosaic and simply a georeferenced image. To dramatically increase data quality, GCPs should be used.
One final point of discussion is that in the maps produced there was data that software tried to interpolate in the south portion and the north-west portion of the image mosaic that shouldn't have been processed. This could potentially be cut out by the clip tool in ArcGIS Pro or ArcMap.
Conclusion:
In conclusion Pix4D is extremely powerful yet fairly simple to use software given adequate knowledge and understanding of the data being used. For example, understanding of the sensor's technical qualities need to be known for fine tuning and a properly executed and planned flight with proper overlap both on the sides and the front are required. In the end data is produced that can be used both by the Pix4D software itself, and other applications such as ESRI ArcGIS applications or CAD applications. This data can be used to create maps of the color ramp symbolized DSMs, ArcScene scenes, or even processed to make hillshade rasters or other images.


No comments:
Post a Comment